
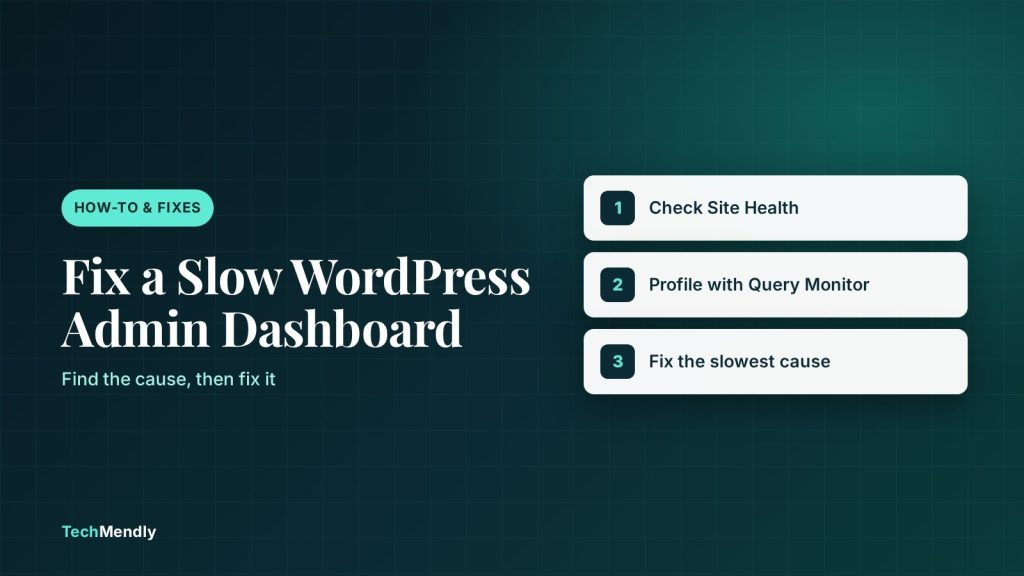
If your WordPress admin is slow but the public site feels fine, the delay is usually server-side work that visitors never trigger: a heavy plugin, slow database queries, an outdated PHP version, background tasks, or outgoing requests that time out. Install Query Monitor, run Site Health, find the slowest component, then apply the matching fix below.
A WordPress admin slow enough to make you wait ten seconds for the Posts screen is a common complaint on shared hosting, and it is easy to misdiagnose. Visitors get fast pages, so you assume the site is healthy. But the dashboard is built fresh by PHP and your database on almost every click, so every inefficient plugin and every slow server call shows up there first.
The good news is that you do not need to guess. This guide shows how to measure where the time goes, then walks through seven fixes in the order we would try them. None of them needs a developer, though a couple involve editing wp-config.php, so take a backup first.
If you also see old content on the front end after saving, that is a different problem, covered in our guide to clearing the right caches when Elementor changes are not showing.
WordPress admin slow: find the cause before you change anything
Changing settings at random makes a slow dashboard harder to fix, because you never learn which change helped. Spend ten minutes measuring first.
- Open Tools > Site Health. The Status tab groups results into Critical issues, Recommended improvements and Passed tests. Look for an outdated PHP version, a failed loopback request, and “Could not reach WordPress.org”.
- Install the free Query Monitor plugin from the plugin directory. By default only Administrators can see its output, and its author says the effect on page generation time is small but not zero, so remove it when you are done.
- Load the slow admin screen, then click the Query Monitor figure in the admin bar. Check the slowest database queries, any failed or slow HTTP API calls, and which plugin or theme each one belongs to.
- Write down the single worst offender. Often one slow plugin or one timing-out request explains most of the delay.
| What you see | Likely cause | Go to |
|---|---|---|
| One plugin dominates the slow queries | Heavy or poorly written plugin | Fix 1 |
| Site Health warns about PHP | Old PHP or database version | Fix 2 |
| Editor lags while typing, constant background requests | Heartbeat polling | Fix 3 |
| Random slow requests, scheduled tasks pile up | WP-Cron firing on page loads | Fix 4 |
| Same queries repeat on every click | No persistent object cache | Fix 5 |
| HTTP API calls take seconds or fail | Blocked or slow outgoing requests | Fix 6 |
| Slow only while debugging is on | Leftover debug settings | Fix 7 |
Fix 1: Find and replace the slow plugin
Query Monitor can group database queries and HTTP calls by plugin, theme or function. If one name keeps appearing at the top, that is your suspect. Deactivate it, reload the same admin screen and compare the load time. If the screen speeds up, you have confirmed it.
Then decide: update it, look for a lighter alternative, or contact its developer with the slow query from Query Monitor as evidence. Always test on a staging copy if the plugin handles orders or memberships.
Do not deactivate everything at once on a live shop. Switch off one suspect at a time, and check checkout still works before moving on.
Fix 2: Update PHP and your database version
WordPress.org currently recommends PHP 8.3 or greater, and MariaDB 10.11 or greater, or MySQL 8.0 or greater. If Site Health says your PHP version is outdated, make this the first change, because Site Health marks an outdated PHP version as a security issue. Our write-up on the PHP2Shell vulnerability and which PHP versions are patched explains why staying current matters.
Your host controls this. In cPanel it is usually under the PHP version selector (often called MultiPHP Manager); other hosts have it in their own panel. Switch one site at a time, then load the front end, the admin and any checkout page. If a plugin throws an error on the newer version, update that plugin or replace it rather than going back to old PHP.
Fix 3: Slow down the Heartbeat API
The WordPress Heartbeat API is a built-in polling system: the browser sends a request to the server on a repeating “tick” that runs every 15 to 120 seconds. On a weak server, many open admin tabs mean many background requests competing with the page you are actually using.
You can lengthen the interval with the heartbeat_settings filter. Add this to a small custom plugin or your child theme’s functions.php:
add_filter( 'heartbeat_settings', function ( $settings ) {
    $settings['interval'] = 60;
    return $settings;
} );
Sixty seconds sits inside the 15 to 120 second range. Close extra admin tabs as well, since each one polls separately. After the change, edit a post and check that it still saves normally.
Treat this as a tuning step, not a cure. If one plugin is making each request slow, a longer interval only hides the symptom.
Fix 4: Move WP-Cron to a real scheduler
By default WordPress does not run scheduled tasks on a clock. It checks for due tasks during page loads, and the WordPress developer documentation notes this adds extra resource usage to your server. If a backup, import or email queue is due, the visit that triggers it can feel slow, and that visit may be yours.
The documented fix has two parts. First, turn off the built-in trigger in wp-config.php:
define( 'DISABLE_WP_CRON', true );Second, make your server call wp-cron.php on a schedule. In cPanel, open Cron Jobs and add a job every 15 minutes with a command like this, replacing the domain:
*/15 * * * * wget --delete-after https://YOUR_SITE_URL/wp-cron.phpIf you disable WP-Cron and never add the system job, scheduled posts, backups and update checks will silently stop running. Confirm a scheduled task fires before you call this done.
Fix 5: Add a persistent object cache
WordPress keeps the results of costly operations, such as database queries, in an object cache so it does not repeat them. According to the developer reference, the object cache is non-persistent by default, so cached data does not survive from one page load to the next unless you install a persistent backend. The same page lists Redis Object Cache and Memcached Object Cache as plugins that provide one.
This only helps if your host runs Redis or Memcached for you, so ask support before installing anything. A page caching plugin is a different tool aimed at visitors. For that side, see our comparison of the best free WordPress caching plugins.
Fix 6: Find slow or blocked outgoing requests
WordPress calls other servers: update checks, plugin licence checks, remote dashboard widgets. If your server cannot reach them quickly, the admin can wait until the request times out. Query Monitor lists each HTTP API call with its response code, the responsible component and the time taken, so look for any that take seconds or fail.
Site Health helps here too. Watch for “Could not reach WordPress.org”, “Your site could not complete a loopback request” and “HTTP requests are blocked”. The last one appears when WP_HTTP_BLOCK_EXTERNAL is set without allowed hosts. Fixes are usually on the server side, such as a firewall rule or a security plugin that blocks outgoing traffic. If Query Monitor points at one plugin making the slow call, deactivate or replace that plugin and test again.
Fix 7: Turn off leftover debug settings
The WordPress debugging documentation warns that debug tools are meant for local development and staging, and that SAVEQUERIES, which stores every query and its timing, affects performance. If a developer left them on, switch them off:
define( 'WP_DEBUG', false );
define( 'SAVEQUERIES', false );
Use real true and false values without quotes, because a quoted string such as 'false' is read as true. If you need to hunt a problem, log errors instead of showing them: WP_DEBUG_LOG writes to wp-content/debug.log and WP_DEBUG_DISPLAY set to false keeps them off the page. Delete the log afterwards, because Site Health flags logging to a potentially public file as a critical issue.
Common mistakes when fixing a slow dashboard
- Installing another speed plugin on top of a slow plugin. It adds work without removing the cause.
- Disabling WP-Cron with no system job in place.
- Leaving Query Monitor active on a production site after you finish testing.
- Changing PHP versions without testing checkout, forms and login first.
After each change, reload the same admin screen and compare against your first measurement, so you know which fix did the work.
Measure first with Site Health and Query Monitor. Update PHP, remove or replace the slowest plugin, move WP-Cron to a real scheduler, add a persistent object cache if your host offers one, and clear out debug settings. Fix one thing at a time so you know what worked.
Frequently asked questions
Why is my WordPress admin slow but my website is fast?
The dashboard runs fresh PHP and database work on each screen, plus background polling and update checks. A plugin that adds work to admin screens only shows up there.
Does the Heartbeat API slow down WordPress?
It can on a weak server, because each open admin tab sends a request every 15 to 120 seconds. Lengthening the interval and closing unused tabs reduces that load, but it will not fix a slow plugin.
Which PHP version should I use for WordPress?
WordPress.org recommends PHP 8.3 or greater. Test on staging first, because older plugins can break on newer PHP.
Will a caching plugin make wp-admin faster?
Not directly. Page caching plugins are aimed at visitors. A persistent object cache such as Redis stores query results between page loads, if your host supports it.
Is it safe to leave Query Monitor installed?
Only administrators see its output by default, but its author says it uses more memory than they would like on pages with hundreds of queries. Remove it once you have your answer.
Sources: WordPress Heartbeat API; heartbeat_settings filter; Query Monitor; Site Health screen; Debugging in WordPress; WordPress requirements; WP-Cron system scheduler; WP_Object_Cache. Checked October 2026.
More in How-To & Fixes
WordPress “The Link You Followed Has Expired”: 5 Fixes
Seeing "The link you followed has expired" in WordPress? Find the upload limit or expired nonce behind it and fix it with the right PHP settings.
Error Establishing a Database Connection: 6 Fixes
Seeing "Error establishing a database connection"? Check wp-config.php, database privileges and repair tools in order, and know when to call your host.
WordPress Critical Error on This Website: 6 Fixes
Seeing "There has been a critical error on this website"? Use the recovery email, debug log and a plugin check to find the cause and fix it fast.